Journal of Southern Academic and Special Librarianship (2000)
ISSN: 1525-321X
Are Transaction Logs Useful? A Ten-Year Study

Journal of Southern Academic and Special Librarianship (2000)ISSN: 1525-321XAre Transaction Logs Useful? A Ten-Year Study |
 |
Julie Banks
Kent Library
Southeast Missouri State University
jbanks@semovm.semo.edu
Transaction log analysis has long been a staple in academic libraries. Recently, for example, authors have reported on transaction logs and their use in identifying access point use, re-engineering the online public access catalog (OPAC), improving search retrieval, utilizing flip charts at terminals, and employing log data for general personnel management. There are still questions left unanswered, however, about the usefulness of transaction log analysis in marshalling personnel resources. One is whether the logs have predictive value over a span of time, and another is whether any useful trends can be discerned from the logs' data. To answer these questions, transaction log totals, i.e., author, title, subject, keyword, and total searches, were collected spring and fall 1998 and spring 1999 semesters for statistical analysis. The researcher contrasted and correlated this data generated at Southeast Missouri State University (SEMO), a mid-sized, regional university with an enrollment of 8,869 undergraduate and graduate students, with comparable data collected ten years ago at SEMO and with data reported by Neal Kaske at the University of Alabama.
Only three research articles directly address the use of transaction logs in library personnel management. Two by Neal Kaske were published in 1988 and 1991. The first, The Variability and Intensity over Time of Subject Searching in an Online Public Access Catalog (1988), provided raw numbers and percentages of author, title, subject, call number and total OPAC searches carried out at the University of Alabama's main and satellite libraries. Here Kaske used subject searching to demonstrate searching variation over time and to identify general trends of OPAC searching for managerial purposes. In his second publication, The Variability of Subject Searching in an Online Public Access Catalog over an Academic Year (1991), Kaske used subject searching to establish a pattern of searching, which he suggested could be useful in scheduling bibliographic instruction classes and one-on-one help sessions when more library personnel would be required in reference.
Banks wondered whether the trends presented by Kaske would hold at other academic libraries and whether it was actually possible to use transaction log data for managerial purposes. To understand if this was the case, she collected transaction log data at SEMO during the spring 1988, spring 1989, and fall 1989 semesters. In Can Transaction Logs Be Used for Resource Scheduling? An Analysis (1999), Banks reported her findings for daily and weekly trends. From her statistical analyses, she found that there were, indeed, some patterns to OPAC use: 1) Graphed weekly search totals resembled an “m-shape” during the semester. 2) The “m-shape” had five distinct phases, including initiation, a peak, holiday period, another peak, and end of the semester. 3) The “m-shape” displayed a variation in OPAC searching intensity during the semester, and this same pattern held true for different semesters and at different universities. 4) Patrons searched more at the beginning of the week than at the end of the week. 5) Fewer searches were conducted the first two weeks of the semester and the last two weeks of the semester than at other times. However, these findings were only general in nature and could not be used to tweak personnel scheduling at the reference desk. Would additional data show the same trends over time and provide a way to schedule librarians in a more effective way?
SEMO's Kent Library has had a NOTIS online catalog since January, 1988. In the beginning, daily transaction logs contained author, title, subject, and total number of searches. Keyword searching has been available only since 1990. At first, there were sixteen in-house terminals; but currently there are forty-one. There are no satellite libraries, and the OPAC at present is not accessible over the Internet. For this study, daily numbers of author, title, subject, keyword, and total OPAC searches were keyed into the Data Entry software (the Statistical Package for the Social Sciences, SPSS) from transaction log printouts. Converting and transferring the data from SPSS into SigmaPlot, the investigator undertook graphic analysis and ascertained correlations between variables.
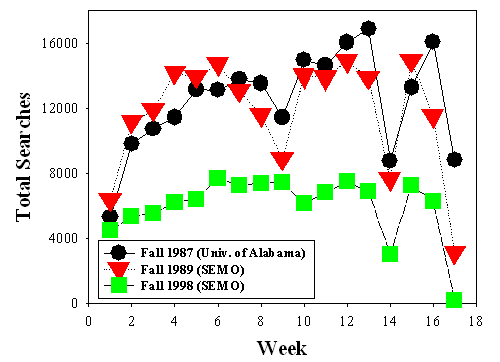
This study builds on a previous one using 1987-1989 data that focused on transaction log analysis for personnel scheduling at the reference desk. After that time, the question was whether the unexpected “m-shape” behavior observed for searches would withstand the test of time. To explore this, the author expanded the analysis an additional ten years to 1999 and included a correlation of building traffic with OPAC searching. The results suggest that transaction logs do have some predictive value and the “m-shape” behavior pattern, reported earlier by Banks, is not an anomaly. This can be seen clearly in figures 1 and 2, which reproduce the search behavior as a function of week of the semester for spring and fall, respectively. It should be noted from the data presented in the figures that searching activity has remarkable similarity even though the data on the graphs include searching activity over an entire decade. In addition, the data are somewhat different in that spring semesters have one more week than fall semesters and keyword searching comes into play only after 1989 at SEMO. Moreover, figure 2 shows that this “m-shape” trend was even observed at an entirely different university library. Because of the similarity of the “m-shape” pattern across time, it is reasonable to suggest that OPAC usage will retain this pattern in the future. Thus, weeks when optimum, personnel scheduling is required can be identified: 3-6, 10-13, and 15 for the fall semester and for spring, weeks 2-8, 10-11, and 13-16. However, these weeks might need to be slightly shifted, depending upon spring break as can be seen in figure 1. The log analysis does, indeed, provide for trends and therefore predicts the most appropriate time when additional staff might be desirable.
Figure 2 points up two additional points. One is that the line for fall 1998 looks much flatter than the other two lines. The reason is that it represents less intense searching. If the y-axis scale is expanded, i.e., the total axis range is made between 0 and 8000, this line will also look “m-shaped.”
The second point is the drastic decline of almost thirty-five percent in OPAC searching at SEMO from fall 1989 to fall 1998. Figure 3 depicts how the building traffic affected the OPAC searching at SEMO for three semesters. Clearly, there is a linear dependence between these two variables. In fact, the linear correlation coefficient, r, is 0.902, suggesting strong dependence. R = 1 is a perfect correlation. This means that if more patrons come to the library more OPAC searches occur, an expected phenomenon. Since building traffic has dropped from 216,025 in the 1988 fall semester to approximately 141,670 in the fall 1998 (35% drop), it is, therefore, not surprising that the number of searches has also dropped dramatically. The declines in searching and in building traffic have many implications for library administrators, some of whom see Internet technology as taking up the slack for the decrease in use of library services. However, the exact reasons for this drop are yet to be ascertained. Perhaps a more clear picture will emerge by comparing current search numbers with those generated after Kent Library's OPAC becomes web based. If, however, fewer numbers of searches remain the norm and if a strong correlation continues between OPAC searching and building traffic, it will be our job at SEMO to find ways to bring students and faculty back into Kent Library so that our facilities and services will be optimally used.
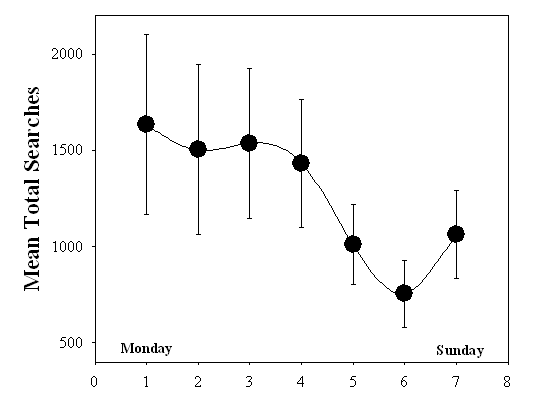
The data presented here not only confirm the presence of the “m-shape” behavior but also afford further support that indeed more manpower is required on Mondays through Thursdays. Figure 4 provides supportive evidence for this trend. The I bars in this figure represent the standard deviations, which clearly show that it is not possible to predict which day of a particular week will always be the busiest. However, since Mondays through Thursdays have consistently been the highest OPAC usage days for ten years, it is clear that the greatest number of reference staff are consistently needed Mondays through Thursdays. This is the case even with the negative downward pressure on the total number of OPAC searches.
Transaction log data do have some predictive value for library managers. After examining ten years of log information, there are several trends that continue: (a) weekly total searches resemble an “m-shape”, (b) fewer searches still occur the first two and last two weeks of the semester, and (c) Mondays through Thursdays remain the highest OPAC usage days. These findings provide reference desk managers with a basic outline of when online searches will be most prevalent, potentially requiring staff to answer more questions about OPAC searching. Though identifying the exact day and hour when additional reference staff might be needed is not possible through transaction log analysis, this method does go a long way toward optimizing personnel usage at the reference desk.
Beyond offering general scheduling information to reference desk managers, transaction logs analysis is important because it clearly identifies the almost perfect correlation between OPAC searches and building traffic. Managers can use either variable to predict library usage. If, like SEMO, building traffic and OPAC use are dropping, administrators will want to begin working on strategies to bring more students and faculty back into the building. If this is not accomplished, the viability of the library's future in the new millennium becomes an issue.


Banks, Julie. “Can Transaction Logs be Used for Resource Scheduling? An Analysis.” The Reference Librarian 63 (1999): 95-108.
Kaske, Neal K. “The Variability and Intensity over Time of Subject Searching in an Online Public Access Catalog.” Information Technologies and Libraries 7 no. 3 (1988): 273-287.
Kaske, Neal K. The Variability of Subject Searching in an Online Public Access Catalog over an Academic Year. In Interfaces for Information Retrieval and Online Systems: The State of the Art, ed. M. Dillon. New York: Greenwood Press, 1991.
© Copyright 2000 Julie Banks
Citation Format
Banks, Julie. (2000). Are Transaction Logs Useful? A Ten-Year Study. Journal of Southern Academic and Special Librarianship: 01 [iuicode: http://www.icaap.org/iuicode?62.01.03.04]